With a background in BSc Statistics, I was looking for a practical and industry-focused approach to Data Analytics, and Unisoft Technologies has met my expectations well. The Python training by Arnab Sir is highly effective — his clear explanations and hands-on approach make it easy to connect theoretical concepts with real-world applications. Unisoft offers a structured curriculum, experienced faculty, and a supportive environment.
#1 Data Analytics Institute in Nagpur
Become a Certified
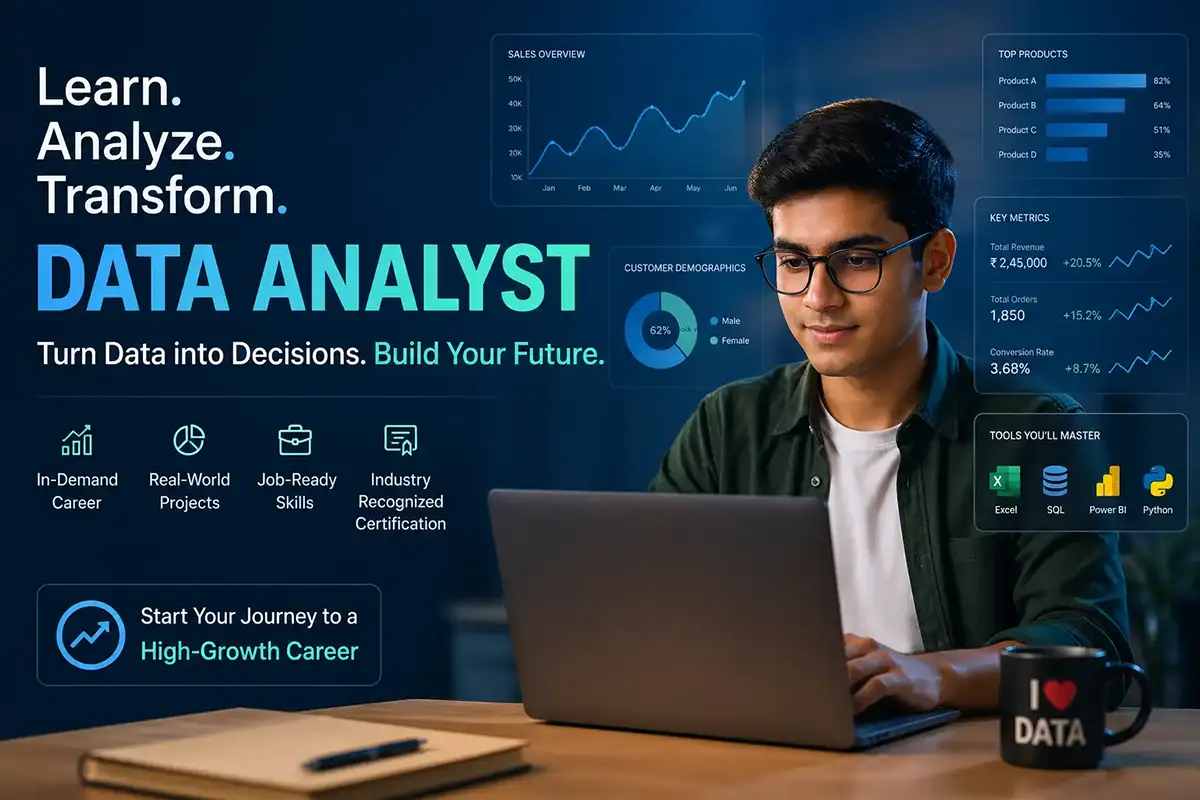
Data Analyst
in Nagpur
Nagpur's most complete data analyst & data analytics course — Excel, SQL, Python, Power BI & Tableau with global certification, live projects, internship & 100% placement assistance.* Classroom, online & weekend batches.
Next Batch Starts
Every Monday
Limited
Seats
500+
Placements done
6 mo
Industry program
3–8 Months
Course Duration
Fees from ₹35,000
EMI Available
Any Graduate
Eligibility
6 Global Certs
Microsoft · Oracle · Tableau
100% Placement
Assistance + Internship
Classroom · Online
Weekday & Weekend Batches
Program Overview
Comprehensive Data Analyst & Analytics Course in Nagpur
At Unisoft Technologies, our industry-recognised data analyst course in Nagpur transforms aspiring professionals into experts. Whether you search for a data analytics course in Nagpur, data analyst classes, or data analytics training near you, this is one program with three flexible tracks. Our 3–8 month curriculum covers Advanced Excel, SQL, Python for data manipulation — with a focused module on Data Visualisation using Power BI or Tableau, plus live projects, a 6-week internship, global certification preparation and 100% placement assistance.
Each module is taught by domain specialists with years of industry experience. Multiple
technologies — SQL, Python, Power BI, Tableau and Advanced Excel — are integrated into a single cohesive
learning journey.
5 Core Technologies
Excel · SQL · Python · Power BI / Tableau — one integrated curriculum
6-8 Month Structured Program
Weekday & weekend batches, hybrid classroom + online options
Capstone Project + Internship
Real-world project & 6-week internship letter from Unisoft or partnered
startup
100% Job Placement Assistance*
Recruiter connects, mock interviews & resume building support
Who Is This For
Built for Every Background
Whether you're in your final year of college or already working — our Data Analyst program is engineered to launch your data career, regardless of your degree stream.
B.Com / M.Com
Commerce → Finance Analytics
Use SQL + Excel + Power BI to land roles in finance, audit, banking and FP&A. Your accounting fundamentals plus modern data tools open senior analyst roles within 2-3 years.
BBA / MBA
Business → Strategy & Consulting
Combine business strategy with hard data skills. MBA + analytics is the highest-paying combination for management consulting and corporate strategy roles in India.
BCA / MCA
Tech → Analytics Pivot
Move beyond generic dev work into specialised data roles. Your programming foundation makes Python and SQL trivial — visualisation skills round out a full-stack analyst profile.
B.Sc / M.Sc (Stats / Maths / IT)
Science → Data Science Trajectory
Statistics and maths majors have the strongest fit for data science. Use this program to operationalise your theory with industry tools, real datasets and a portfolio.
BE / B.Tech (Any Branch)
Engineering → Cross-Domain Analytics
Computer Science, IT, EE, Mechanical, Civil — every branch is hiring data analysts. Specialise beyond your core to unlock IT, manufacturing and telecom analytics roles.
BA / MA Economics
Economics → Quantitative Research
Econometrics + Python + Tableau makes you a research analyst across consulting firms, think tanks and policy organisations. High-impact, intellectually rigorous careers await.
Working Professionals
Switch Lane → Data Career
Already employed but hitting a ceiling? Our weekend and evening batches are designed for working professionals. Upskill on Power BI, SQL and Python alongside your day job.
Career Switchers / Freshers
Fresh Start → Data Analyst
No coding background? No problem. Our Foundation track starts from absolute basics. Career switchers from non-tech backgrounds — teachers, sales, ops — placed every batch.
Curriculum
What You'll Learn in Our Data Analyst Course
Every module is mapped to real job roles. Click any module to expand the topics.
01
Microsoft Excel — Advanced
Foundation Phase · 30 Chapters · MO-210 / MO-211 Aligned
Build the spreadsheet fluency every analyst needs — from data cleaning to dynamic dashboards. 30 chapters covering 300+ topics including all 27+ Excel 2024 functions (LAMBDA, GROUPBY, PIVOTBY, TEXTSPLIT, VSTACK and more). Every concept is hands-on with real datasets and case studies.
1.1
Excel Fundamentals for Analysts
- Workbook structure, ribbons, custom views
- Cell formatting and conditional formatting
- Data validation rules and dropdowns
- Keyboard shortcuts for analyst speed
- Named ranges and table objects
1.2
Advanced Formulas & Functions
- Logical: IF, IFS, AND, OR, IFERROR, SWITCH
- Lookup: VLOOKUP, HLOOKUP, XLOOKUP, INDEX-MATCH
- Text: CONCAT, TEXTJOIN, TRIM, SUBSTITUTE
- Date/Time: DATEDIF, NETWORKDAYS, EDATE, EOMONTH
- Statistical: COUNTIFS, SUMIFS, AVERAGEIFS, RANK
1.3
Pivot Tables & Pivot Charts
- Creating, customising and styling pivot tables
- Calculated fields and calculated items
- Slicers, timelines and value field settings
- GETPIVOTDATA for dynamic reporting
- Pivot charts and dashboard composition
1.4
Power Query & Power Pivot
- Importing from CSV, web, SQL, folder, JSON
- Cleaning, shaping and transforming data
- Merging and appending queries (JOIN / UNION)
- Power Pivot for relational data models
- Custom M language functions
1.5
Dynamic Arrays & Excel 2024 Functions
- LAMBDA, LET, SEQUENCE, FILTER, SORT, UNIQUE
- GROUPBY, PIVOTBY for in-formula aggregation
- TEXTSPLIT, TEXTBEFORE, TEXTAFTER, REGEX
- VSTACK, HSTACK, CHOOSEROWS, CHOOSECOLS
- MAP, REDUCE, SCAN, MAKEARRAY for array logic
1.6
Macros, VBA & Automation
- Recording, editing and securing macros
- VBA editor — variables, loops, conditionals
- Working with ranges, sheets, workbooks
- User forms and event procedures
- Automating recurring reports end-to-end
1.7
Statistical Analysis & Forecasting
- Descriptive statistics (Analysis ToolPak)
- Hypothesis testing and correlation analysis
- Linear regression with TREND, FORECAST
- What-if analysis: Goal Seek, Scenarios, Solver
- Forecast Sheet and time-series projections
1.8
MO-210 & MO-211 Certification Prep
- MO-210 Excel Associate exam objectives
- MO-211 Excel Expert advanced topics
- Timed mock tests with pattern analysis
- Hands-on lab simulations
- On-site Pearson VUE testing centre
02
SQL — Oracle AI Database 23.26.1
Database Phase · 90 Classes · 1Z0-171 Aligned
Master the language databases speak. 180+ hours of live training across 7 modules on Oracle's latest 23ai release — from RDBMS fundamentals to window functions, indexing and the new QUALIFY clause. Prepare for the 1Z0-171 exam, delivered online via Oracle's own Testing Network, with Unisoft handling prep and booking guidance.
2.1
SQL Foundations & Oracle Setup
- RDBMS concepts and Oracle architecture
- SQL*Plus and SQL Developer environment
- SELECT, WHERE, ORDER BY mastery
- DISTINCT, NULL handling, ROWNUM usage
- Arithmetic expressions and operator precedence
2.2
Single-Row & Group Functions
- Character: UPPER, LOWER, SUBSTR, INSTR, TRIM, LPAD
- Number: ROUND, TRUNC, MOD, CEIL, FLOOR, POWER
- Date: SYSDATE, ADD_MONTHS, MONTHS_BETWEEN, NEXT_DAY
- Conversion: TO_CHAR, TO_DATE, TO_NUMBER, format masks
- NVL, NVL2, NULLIF, COALESCE, DECODE, CASE
- Aggregate: SUM, COUNT, AVG with GROUP BY / HAVING
2.3
Joins & Multi-Table Queries
- INNER JOIN — EQUIJOIN and NON-EQUIJOIN
- OUTER JOINs — LEFT, RIGHT, FULL OUTER
- SELF JOIN and CROSS JOIN (Cartesian)
- NATURAL JOIN and USING clause
- ANSI SQL vs Oracle proprietary (+) syntax
2.4
Subqueries & Set Operators
- Single-row and multi-row subqueries (ANY, ALL, IN)
- Correlated subqueries with EXISTS / NOT EXISTS
- Scalar subqueries in SELECT, WHERE, HAVING
- Inline views and CTEs (WITH clause)
- QUALIFY clause — new in Oracle 23ai
- UNION, UNION ALL, INTERSECT, MINUS
2.5
DDL, DML & Transaction Control
- DDL: CREATE, ALTER, DROP, TRUNCATE, RENAME
- DML: INSERT, UPDATE, DELETE, MERGE
- TCL: COMMIT, ROLLBACK, SAVEPOINT
- Constraints: PK, FK, UNIQUE, NOT NULL, CHECK
- Sequences, synonyms, indexes and views
2.6
User Access, Privileges & Security
- CREATE / ALTER / DROP USER in Oracle
- GRANT & REVOKE — system + object privileges
- Role management and default roles
- USER_, ALL_, DBA_ data dictionary views
- Security best practices for production DBs
2.7
Window Functions & Optimisation
- ROW_NUMBER, RANK, DENSE_RANK, NTILE
- LEAD, LAG, FIRST_VALUE, LAST_VALUE
- PARTITION BY and ORDER BY in OVER clause
- ROLLUP, CUBE, GROUPING SETS
- EXPLAIN PLAN and execution plan analysis
- Indexing strategies and performance tuning
2.8
1Z0-171 Certification Prep
- Timed mock exams & practice tests at Unisoft
- Topic-by-topic revision sheets
- Scenario-based interview question bank
- Oracle 23ai-specific feature coverage
- 1-on-1 doubt resolution sessions
03
Python for Data Analysis
Core Analytics Phase · 12 Modules · Project-Driven
The programmatic skills that separate junior analysts from senior ones — automation, EDA, and end-to-end pipelines. 11 sub-modules covering 60+ topics spanning Python fundamentals, NumPy, Pandas, data cleaning, EDA, visualisation and SQL integration — the foundation for the data scientist trajectory.
3.1
Python Fundamentals & Setup
- Anaconda, Jupyter and VS Code installation
- Variables, data types and type casting
- Operators: arithmetic, logical, comparison
- Control flow: if/elif/else, for, while loops
- String operations and f-string formatting
3.2
Data Structures & Comprehensions
- Lists: indexing, slicing, methods
- Tuples: immutability and use cases
- Dictionaries: CRUD, nested dicts
- Sets: union, intersection, difference
- List, dict and set comprehensions
3.3
Functions, Modules & Exceptions
- Functions: args, kwargs, default params
- Lambda, map, filter, reduce
- Decorators and closures
- Standard library: os, sys, datetime, math
- Try/except/finally and custom exceptions
3.4
NumPy — Numerical Computing
- ndarray creation, shape, reshape, dtype
- Indexing, fancy indexing, boolean masking
- Broadcasting rules and ufuncs
- Statistical ops: mean, median, std, percentiles
- Linear algebra and random generation
3.5
Pandas — Data Manipulation
- Series and DataFrame fundamentals
- Data loading: CSV, Excel, JSON, SQL, Parquet
- loc, iloc and query() for selection
- GroupBy, aggregation and pivot tables
- Merge, join, concat operations
- Time series and DateTime handling
3.6
Data Cleaning & Preprocessing
- Detecting and handling missing values
- Duplicate detection and removal
- Outlier detection: IQR and Z-Score methods
- String cleaning with regex
- Normalisation and standardisation
3.7
Exploratory Data Analysis (EDA)
- EDA framework and methodology
- Univariate, bivariate, multivariate analysis
- Distribution analysis and skewness
- Correlation analysis and heatmaps
- Pattern, trend and anomaly detection
3.8
Visualisation — Matplotlib, Seaborn, Plotly
- Matplotlib: figure, axes, subplots
- Line, bar, scatter, histogram, pie charts
- Seaborn: heatmaps, violin, pair, box plots
- Interactive plots with Plotly
- Dashboard design principles
3.9
File I/O & Data Sources
- Reading and writing CSV, Excel, JSON
- Web APIs with the requests library
- Web scraping with BeautifulSoup
- Parquet and Feather for fast I/O
- openpyxl for Excel automation
3.10
SQL Integration with Python
- SQLite and MySQL with Python connectors
- SQLAlchemy ORM basics
- Reading DB data into DataFrames
- Writing analysis results back to DB
- Parameterised queries and security
3.11
Real-World Projects & Portfolio
- Mini-projects: sales, customer, finance, healthcare
- Capstone: end-to-end analytics pipeline
- GitHub portfolio setup
- LinkedIn case study writing
- Stakeholder presentation skills
04
Data Visualisation — Power BI or Tableau
Visualisation Phase · Choose One Tool · Cert-Aligned
Tell stories with data — build the dashboards hiring managers ask candidates to recreate. Pick one visualisation tool based on your career goals. Both tracks include certification preparation at our on-site Pearson VUE centre.
Track A
Power BI
4A.1
Get & Prepare the Data
- Connect to flat files: CSV, Excel, JSON, XML, PDF
- SQL Server, MySQL, Oracle, PostgreSQL, Azure SQL
- Power Query Editor: clean, transform, shape
- Merge (JOIN) and Append (UNION) queries
- Custom M language functions and incremental refresh
4A.2
Model the Data & Core DAX
- Star schema and snowflake schema design
- Fact tables, dimension tables, calendar tables
- Relationships: cardinality, cross-filter direction
- DAX measures, calculated columns, calculated tables
- CALCULATE, FILTER, ALL, ALLEXCEPT, RELATED
- Time intelligence: TOTALYTD, SAMEPERIODLASTYEAR, DATEADD
4A.3
Advanced DAX Patterns
- Iterator (X) functions and performance implications
- Table functions: SUMMARIZE, ADDCOLUMNS, TREATAS
- Row context vs filter context, context transition
- Calculation groups and field parameters
- Currency conversion and what-if parameter patterns
- Rolling averages, YTD/QTD/MTD calculations
4A.4
Visualise & Analyse
- Core visuals: bar, line, pie, scatter, map, matrix
- Advanced: decomposition tree, key influencers, smart narrative
- Slicers, filters, drill-through, drill-down
- Conditional formatting and tooltips
- Mobile-optimised report layouts
- Q&A natural language queries
4A.5
Deploy, Maintain & Govern
- Publish to Power BI Service (cloud workspace)
- Workspace roles: Admin, Member, Contributor, Viewer
- Scheduled refresh and DirectQuery
- On-Premises Data Gateway setup
- Power BI Apps and deployment pipelines
- Embed in SharePoint, Teams and web apps
4A.6
Security, RLS & Service Features
- Row-Level Security (RLS) — static and dynamic
- Object-Level Security (OLS) for sensitive columns
- Sensitivity labels with Microsoft Purview
- Power BI Dataflows and Paginated Reports
- Microsoft Fabric and OneLake overview
4A.7
PL-300 Certification Prep
- Full-length timed mock exams
- Domain-by-domain answer analysis
- Exam strategy and time management
- 5 capstone dashboards: Retail, HR, Finance, Supply Chain, RFM
- On-site Pearson VUE testing
Track B
Tableau
4B.1
Tableau Foundations
- Tableau Desktop, Public, Server, Online overview
- Workspace: shelves, cards, marks
- Connecting to Excel, CSV, SQL, Oracle
- Dimensions vs measures, discrete vs continuous
- Live connection vs Tableau Extract (.hyper)
4B.2
Charts & "Show Me" Visualisations
- Bar, line, pie, area, scatter, histogram
- Tree maps, heat maps, bullet charts
- Dual-axis and combo charts
- Geographic maps (Symbol, Filled, Density)
- Show Me — all chart types unlocked
- Visual design best practices
4B.3
Calculations, Table Calcs & LOD
- Calculated fields: string, date, number functions
- Aggregations: SUM, AVG, COUNTD
- Conditional logic: IF, IIF, CASE
- Quick table calcs: Running Total, % of Total
- LOD expressions: FIXED, INCLUDE, EXCLUDE
- Parameters and analytics pane (trend, forecast)
4B.4
Dashboards & Storytelling
- Dashboard layout: fixed vs automatic
- Filters: quick, context, sets
- Actions: filter, highlight, URL
- Tooltips, annotations, reference lines
- Mobile and responsive dashboard design
- Story Points for narrative flow
4B.5
Data Management & Joins
- Data joins: inner, left, right, full outer
- Data blending across multiple sources
- Unions and pivoting data
- Cross-database joins
- Working with large datasets efficiently
- Data Interpreter cleaning techniques
4B.6
Tableau Certification Prep
- Tableau Desktop Specialist exam pattern
- Tableau Certified Data Analyst syllabus
- Practice exams and mock tests
- Capstone: end-to-end business dashboard
- Publishing to Tableau Public / Server
- Portfolio building for interviews
05
Capstone Project & Internship
Industry Phase · 6-Week Internship · Real-World Stakeholders
Convert classroom skills into industry credibility — build a portfolio recruiters can verify. 5 sub-phases covering 25+ deliverables, anchored by a 6-week paid internship with Unisoft or one of our partnered startups. By the end, your resume reads like someone with 1+ year of experience.
5.1
Capstone Project Selection
- Industry choice: retail, finance, healthcare, e-commerce
- Real dataset acquisition and licensing
- Problem statement definition and scoping
- Project timeline and milestone planning
- Tooling stack confirmation (SQL/Python/PBI/Tableau)
5.2
End-to-End Analytics Pipeline
- Data ingestion (SQL, Python, APIs)
- Cleaning, transformation and feature engineering
- Exploratory Data Analysis (EDA) write-up
- Dashboard / report construction
- Stakeholder presentation rehearsal
5.3
6-Week Industry Internship
- Placement at Unisoft or partnered startup
- Daily standups with assigned industry mentor
- Weekly sprint reviews and feedback cycles
- Real client deliverables (not training exercises)
- Internship completion certificate + reference letter
5.4
GitHub Portfolio & LinkedIn
- GitHub repository setup and best practices
- README writing for analyst portfolios
- LinkedIn case study posts and content cadence
- Personal portfolio site (optional)
- Showcasing 3+ projects to recruiters
5.5
Resume, Interview & Career Prep
- ATS-optimised resume writing
- LinkedIn profile rebuild for analyst roles
- 5+ mock interviews with structured feedback
- SQL / Python live coding interview practice
- Behavioural and case-study interview prep
- Direct connects to 200+ hiring partners
Skills &
Outcomes
Data Analyst Skills You'll Actually Gain
A curriculum only matters if it leaves you with skills employers pay for. Here's the exact map — every module translates into a named, job-ready data analyst skill and why recruiters value it.
Data Cleaning & Wrangling
Analysts spend up to 80% of their time preparing messy data. It's the first skill every employer screens for — and the one that makes every later step possible.
FromExcel & Python (Pandas) modules
RoleData Analyst · MIS Executive
SQL Querying & Joins
SQL is non-negotiable — it appears in nearly every data analyst job description. Pulling, joining and aggregating data from databases is the day-one skill recruiters test live.
FromOracle SQL module
CertOracle 1Z0-171
Statistical Analysis
Knowing averages, distributions, correlation and hypothesis testing is what separates a chart-maker from an analyst who can defend a recommendation to leadership.
FromExcel Stats + Python EDA
RoleData / Research Analyst
Data Visualisation & Dashboards
Interactive Power BI / Tableau dashboards are the deliverable hiring managers ask you to recreate in interviews. Visualisation is how your analysis reaches decision-makers.
FromPower BI / Tableau module
CertPL-300 / Tableau DA
Python for Data Automation
Pandas, NumPy and scripting turn hours of manual reporting into a one-click job. Python is the skill that future-proofs your career toward senior and data-science roles.
FromPython for Data Analysis
CertPython Institute PCAD
Business & Domain Acumen
Numbers mean nothing without context. Framing the right business question and translating data into ₹ impact is the skill that gets analysts promoted to BI & strategy roles.
FromCapstone + live projects
RoleBusiness Intelligence Analyst
Data Storytelling & Communication
A dashboard nobody understands is wasted work. Presenting insights clearly to non-technical stakeholders is a top-cited skill in analyst job postings — and we drill it in mocks.
FromCapstone presentation + mocks
RoleAll analyst roles
Advanced Excel & Spreadsheet Modelling
Excel is still the universal business tool. Pivot tables, Power Query, dynamic dashboards and modelling are tested in almost every entry-level analyst and MIS interview.
FromMicrosoft Excel module
CertMicrosoft MO-210 / MO-211
Tools &
Technologies
Industry-Standard Tools You'll Master
Microsoft
Excel
Oracle AI Database
23.26.1
Python 3
Pandas
NumPy
Power BI
Tableau
Matplotlib
Seaborn
Power Query
DAX
Jupyter
Notebook
VS Code
Decision Matrix
Power BI or Tableau — Which Should You Pick?
Both tools are world-class. Your choice depends on the industry you're targeting, learning style and the kind of analyst career you want to build.
| Criterion | Power BI | Tableau |
|---|---|---|
| Best For | Microsoft-stack companies, finance teams, corporate BI roles | Visualisation-heavy work, analytics consultancies, agencies |
| Learning Curve | Easy — DAX is the only steep part | Moderate — drag-drop is intuitive; LOD takes time |
| Industry Adoption (India) | Very high — corporates default to Power BI | High — preferred by analytics consultancies and global firms |
| Salary Impact (Nagpur) | ₹4L – ₹12L per year | ₹4L – ₹14L per year |
| Free Tier | Power BI Desktop is free; Service requires a license | Tableau Public is free; Desktop is paid |
| Certification | PL-300 (Microsoft Power BI Data Analyst Associate) | Tableau Desktop Specialist (Salesforce) |
| Verdict | Pick if: you want broader job count and ecosystem fit with Microsoft 365. | Pick if: you love visualisation craft and want consulting-style roles. |
Why Choose Us
Why Learn Data Analytics with Unisoft?
25+ Years of Training Excellence
Founded in September 2000, Unisoft has trained professionals across Nagpur's IT
ecosystem for over two decades.
Live Mentor-Led Batches
Every batch is led by a domain specialist — no pre-recorded filler. Real-time
doubt-solving with 1:1 mentor sessions.
Flexible Learning Options
Weekday, weekend and hybrid batches available. Learn in-person at Dharampeth or
online with Renu Nair.
Capstone + Internship Letter
A 6-week internship certificate from Unisoft or a partnered startup gives your
resume real credibility.
Placement Cell & Recruiter Connects
Trusted by 200+ IT companies for referrals. We help with interviews, mock
assessments & resume reviews.
Pearson VUE Certified Exam Centre
Authorised Pearson VUE Examination Centre —
certifications you can take right here in Nagpur.
Our Faculty
Meet Our Industry Experts
Senior architects. Industry-fresh specialists. One unified curriculum — designed by our CTO Saurabh Joshi and delivered by his hand-picked, mentored team.

Saurabh Joshi
Oracle OCP DBA · OCA-SQL · SQL, Excel & Tableau
16+ yrs
Experience
5K+
Trained
Oracle OCP DBA
OCA-SQL
MO-211 Expert
MO-210
CTO
Credly Verified

Renu Nair
SQL · Power BI · Tableau · Excel
10+ yrs
Experience
1.5K+
1-on-1 Trained
PL/SQL
Power BI
Tableau
Online Specialist
Credly Verified

Raina Nair
Python · Machine Learning · SQL
9+ yrs
Experience
2K+
Trained
Python
Machine Learning
Scikit-learn
ML & AI
Credly Verified

Arnab Banerjee
Python for Data Analytics
2+ yrs
Teaching
150+
Trained
Python
Pandas
Full Stack Bg.
Python Specialist
Mentored by Saurabh Joshi · Industry-Fresh

Vaibhavi Petkar
Oracle SQL for Data Analytics
1.5+ yrs
Teaching
100+
Trained
Oracle SQL
Joins & Subqueries
C / C++ Bg.
SQL Specialist
Trained at Unisoft · Mentored by Saurabh Joshi

Akshay Kalloo
Power BI · Industry-Experienced · Data Visualisation
1+ yr
Teaching
50+
Trained
Power BI
DAX
Industry Pro
Power BI Trainer
Industry Practitioner · Mentored by Saurabh Joshi
Our Faculty Architecture
Senior architects. Industry-fresh specialists. One unified curriculum.
Every trainer at Unisoft follows the curriculum designed by our CTO Saurabh Joshi and is personally mentored by him for 6+ months before independently delivering a batch. Junior trainers focus on a single specialised subject — meaning they know that topic cold, often more current with the latest tool versions and 2026 interview patterns than any generalist would be. The model mirrors how IIT, IIM and IIT-Bombay operate: senior faculty design courses; specialised assistant professors deliver them.
01
Senior-Architected
Saurabh Joshi (16+ yrs · Oracle OCP DBA · OCA-SQL · MO-211) personally designs every module's syllabus, exercises, certification path and quality bar.
02
Specialist Delivery
Each subject has a dedicated trainer who teaches only that one subject — 100% depth on Python, SQL or Power BI instead of 80% across five subjects.
03
Industry-Fresh
Junior trainers were on the receiving end of analyst interviews 18 months ago — they know the exact questions Infosys, TCS and Persistent are asking this year.
* Classes are conducted by certified faculty subject to availability.
The Roadmap
How to Become a Data Analyst — From Day 1 to Day 240
Eight milestones. Four phases. Six to eight months. This is the exact path our 80,000+ alumni have walked — engineered to take you from "where do I start?" to your first offer letter.
Phase 01 · The Setup
Foundation — Months 0 to 2
01
Pick Your Path
Start by choosing your track based on background, time available and career goals. Foundation suits B.Com freshers and career switchers. Pro is the flagship for graduates. Advanced is for science and engineering grads chasing data science.
- Free counselling session with academic advisor
- Background, goals and constraints assessment
- Personalised track selection — Foundation, Pro or Advanced
- Batch slot booking and orientation
Personalised learning roadmap
02
Master Microsoft Excel
Excel is still the lingua franca of business analytics in India. Master far beyond formulas — Power Query, dynamic dashboards, VBA basics, and the statistical analysis tooling most analyst interviews still test.
- Advanced formulas — XLOOKUP, INDEX-MATCH, IFS, dynamic arrays
- Pivot tables, slicers and cross-filtered dashboards
- Power Query for cleaning, merging and shaping data
- MO-210 and MO-211 certification readiness
2 dashboards + MO-210 cert prep
Phase 02 · The Stack
Core Tools — Months 2 to 4
03
Become Fluent in SQL
SQL is non-negotiable for data analysts. You'll learn Oracle SQL deeply — queries, joins, window functions, query optimisation — and prepare for the 1Z0-171 exam, delivered online via Oracle's own Testing Network, with booking guidance from Unisoft.
- SELECT, WHERE, ORDER BY, GROUP BY mastery
- Inner, outer, cross and self joins
- Window functions (RANK, ROW_NUMBER, LAG/LEAD)
- Stored procedures, indexing and 1Z0-171 prep
1Z0-171 readiness + SQL portfolio
04
Add Python for Data Analysis
Python opens automation, data science and the senior analyst trajectory. Pandas, NumPy and the visualisation libraries become daily tools — and the foundation for the Advanced track.
- Python basics, data structures and control flow
- NumPy arrays and vectorised operations
- Pandas — DataFrames, wrangling, EDA
- Matplotlib and Seaborn for static visualisation
2 EDA notebooks on real datasets
Phase 03 · The Edge
Specialisation — Months 4 to 6
05
Specialise in Power BI or Tableau
Now pick your visualisation tool using the decision matrix above. You'll build expert-level interactive dashboards — the exact deliverable hiring managers ask candidates to recreate during interviews.
- Power BI Desktop + DAX, OR Tableau + LOD expressions
- Data modelling, relationships and measures
- Interactive dashboards with drill-down and slicers
- PL-300 or Tableau Desktop Specialist preparation
3 production-quality dashboards
06
Build Your Project Portfolio
Recruiters want proof, not promises. You'll build three end-to-end analytics projects across different industries and publish them — GitHub, LinkedIn, and a personal portfolio site we help you set up.
- Project 1 — Sales analytics dashboard with forecasting
- Project 2 — Customer churn EDA in Python
- Project 3 — Capstone with full data pipeline
- GitHub, LinkedIn case studies and portfolio page
Public portfolio with 3+ projects
Phase 04 · The Payoff
Career Launch — Months 6 to 8
07
Complete Industry Internship
Apply your skills to real business problems with a partnered company. The six-week internship gives you the "1+ year experience" most entry-level postings ask for — before you've even applied for your first job.
- 6-week internship with assigned industry mentor
- Real client / partnered startup project
- Daily standups, weekly reviews, sprint demos
- Internship completion certificate and reference letter
Internship certificate + reference
08
Land Your First Role
We don't stop at training. Resume building, LinkedIn revamp, mock interviews, recruiter connects, aptitude prep — we run this loop with you until there's an offer letter in your inbox.
- ATS-optimised resume + LinkedIn profile rebuild
- 5+ mock interviews with structured feedback
- Direct connects with 200+ hiring partners
- Aptitude tests and case-study practice rounds
First Data Analyst offer in hand
Welcome to your data career.
By month 8, you're not just job-ready — you're hired. Eight months ago you couldn't write a SELECT statement; today you're a Data Analyst with a real internship, three portfolio projects and an offer letter on the table.
₹3.5L–₹6L
Starting salary in Nagpur
6 weeks
Real industry exposure
200+
Hiring partner network
Career Outcomes
Where Our Data Analysts Get Hired
Data Analyst / MIS Executive
₹3.5L – ₹8L per year
Business Intelligence Analyst
₹4L – ₹10L per year
Power BI / Tableau Developer
₹4L – ₹12L per year
Junior Data Scientist
₹5L – ₹14L per year
Database Administrator
₹4L – ₹11L per year
Career Path
Compass
Data Analyst vs Data Scientist vs BI Analyst
Three closely-related roles, three different career arcs. Here's how they really differ — so you can pick the path that fits your strengths and ambition.
Most Common Entry Role
Data Analyst
- Primary ToolsExcel, SQL, Power BI / Tableau, Python (basics)
- FocusReports, dashboards, descriptive analytics, storytelling with data
- Salary (Nagpur)₹3.5L – ₹12L per year
- Experience0 – 4 years
- Best Fit BackgroundB.Com, BBA, BCA, B.Sc, BE — any stream
- Career TrajectorySenior Analyst → BI Lead → Analytics Manager
Highest Earning Track
Data Scientist
- Primary ToolsPython, R, scikit-learn, TensorFlow, advanced SQL
- FocusPredictive models, machine learning, A/B testing, forecasting
- Salary (Nagpur)₹6L – ₹22L per year
- Experience2 – 8 years (often after an analyst stint)
- Best Fit BackgroundB.Sc Stats / Maths, B.Tech CS, MCA — strong stats helps
- Career TrajectorySenior DS → Lead DS → Head of Data Science
Enterprise & Corporate Track
BI Analyst
- Primary ToolsPower BI / Tableau, SQL, DAX, Excel, MDX
- FocusEnterprise dashboards, KPIs, executive reporting, governance
- Salary (Nagpur)₹4L – ₹14L per year
- Experience1 – 6 years
- Best Fit BackgroundBBA, MBA, B.Com, BCA — business-savvy candidates
- Career TrajectorySenior BI → BI Manager → Director of BI
Still deciding between Data Analyst and Data Scientist as a career?
Read the Full Data Analyst vs Data Scientist Guide Vidarbha
Coverage
Trusted by Students Across Vidarbha & Beyond
Located in Dharampeth, Nagpur — the geographic and academic heart of Vidarbha — Unisoft Technologies attracts data analytics learners from every district of the region, and across India through online cohorts.
Cities & Districts We Serve
Nagpur
Amravati
Akola
Wardha
Yavatmal
Chandrapur
Bhandara
Gondia
Gadchiroli
Washim
Buldhana
Hingna
Kamptee
Katol
Saoner
Pune
Nashik
Aurangabad
Mumbai
Online · Pan India
The Dharampeth campus is walking distance from Sitabuldi and Civil Lines, with easy auto / bus access from Mahal, Itwari, Pratap Nagar and Sadar. Out-of-town students from Wardha and Amravati typically attend the weekend hybrid track or online live cohorts.
Trusted by Students from Top Vidarbha Colleges & Universities
RTMNU (Nagpur University)
VNIT Nagpur
IIM Nagpur
AIIMS Nagpur
Symbiosis Nagpur
G.H. Raisoni
YCCE
RCOEM
SGBAU Amravati
Gondwana University
Kavikulguru Institute
Hislop College
Dharampeth M.P. Deo
Shivaji Science College
Explore More
Related Courses in Data Analytics
Our Data Analyst program includes specialised training in several tools widely used across the industry.
Database
Explore
Oracle AI Database 23.26.1
Queries, JOINs & 1Z0-171 certification
Spreadsheets
Explore
Advanced Excel
Pivot, Power Query & MO-211 Expert cert
Programming
Explore
Python Analytics
Pandas, NumPy & real data projects
BI & Reporting
Explore
Power BI
DAX, dashboards & PL-300 prep
Visualisation
Explore
Tableau
LOD, stories & interactive dashboards
Also Explore
Student Reviews
Hear From Our Students
Real, verified Google reviews — written by current and recently-completed students of our Data Analytics program.
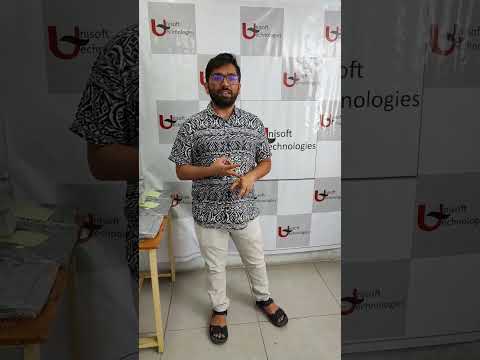
I recently enrolled in the Data Analytics course at Unisoft Technologies. I am currently learning Python under Arnab Sir, whose teaching style is clear, practical, and highly supportive for beginners. Coming from Ambazari, Nagpur, I chose this institute because of its strong reputation in IT training. I was also referred by my sister, who previously completed her .NET training here. Unisoft provides good guidance and a well-organised learning environment.
I spent almost 8 months at Unisoft Technologies, and my overall experience was excellent. The syllabus is up-to-date with current industry standards. I enrolled in the Data Analytics course, where I was mentored by Akshay Chichghare Sir for SQL, Python and Excel — he is highly dedicated and truly second to none. His guidance helped us build strong projects. I also learned Power BI from Akshay Kallo Sir — he ensures no student is left behind.
Unisoft Technologies has honestly been such a good experience for learning Data Analytics. The trainers actually explain concepts in a simple way and help you until you fully get it. We also worked on real projects, which boosted my confidence a lot. The environment is supportive, and the team is always ready to guide you. If you're serious about starting a career in data analytics, I'd definitely recommend Unisoft!
The Data Science course at Unisoft Technologies is amazing! We 4 friends in a batch learned everything from Python and Statistics to Machine Learning and AI tools. Faculty members simplify even the toughest topics. What I loved most was the mentoring sessions that helped me build a real analytics portfolio.
Video Stories



Real Placements
Where Our Data Analysts Work Now
Skeptical about placement claims? Good — you should be. So we don't ask you to trust us. Here are real Unisoft alumni from our Data Analytics & SQL tracks, each with a verifiable LinkedIn profile you can check yourself.
100% LinkedIn-verifiable · Shared with student consent

NS
'24
Nancy Soni
Data Analyst
at HotelKey
Data Analytics
LinkedIn

PK
'24
Pratik Kurhekar
Data Analyst
at Tata Consultancy Services
Data Analytics & SQL
LinkedIn

AW
'25
Aditya Warghane
Data Analyst
at Figment Global Solution
Data Science
LinkedIn

HS
'23
Himanshu Surkar
Data Analyst
at HotelKey
Data Analytics
LinkedIn

PU
'23
Paras Udapurkar
Jr. Product Analyst
at HotelKey
Data Analytics & SQL
LinkedIn

VB
'23
Vaishnavi Bajirao
Data Analyst
at Capgemini
Data Analytics
LinkedIn

AM
'23
Aditya Moreshiya
SQL Developer
at Transrail Lighting Limited
SQL Course
LinkedIn

BT
'22
Bodhiratna Talware
Business Analyst
at Turing
Data Analytics
LinkedIn

PK
'22
Pranay Kalbande
Data Analyst
at Precision IT Services
Data Analytics
LinkedIn

PD
'22
Prachi Dahiwale
SQL / Database Developer
at MKP IT Services Pvt Ltd
Oracle Database SQL
LinkedIn

YS
'22
Yugesh Sharnagat
SQL / Database Developer
at PwC India
Oracle Database SQL
LinkedIn
These are just our data & SQL alumni.
See all 101+ verified Unisoft alumni
across every track — Java, Python, .NET, Cloud, Testing & more — each with a real LinkedIn profile.
A curated glimpse of our recent Data Analytics & SQL alumni — not our complete history or total numbers. Shared publicly with each student's explicit consent. Unisoft provides placement assistance, not a guarantee — outcomes depend on individual performance and market conditions.
Pearson VUE
Authorised Centre · Since 2010
Walk Out with a Globally Recognised Certification
Unisoft is one of Nagpur's longest-running Pearson VUE Authorised Test Centres — operating since 2010. We don't just train you for global certifications from Microsoft, Oracle, Salesforce and the Python Institute — we let you sit for them right here at our Dharampeth campus.
15+ yrs
Pearson VUE Authorised
6 exams · 4 brands
Microsoft · Oracle · Salesforce · Python Institute
1 stop
Train · Practise · Certify · Hire
Oracle
Online · Prep at Unisoft
Oracle AI Database SQL Certified Associate
1Z0-171 · Oracle AI Database (23ai / 26ai)
60
Questions
120 min
Duration
65%
Pass
$245
Cost
FormatMultiple Choice · Online proctored
ValidityLifetime — no expiry
SkillsJoins · Subqueries · Window Functions · DDL/DML · QUALIFY clause
Delivered via Oracle Testing Network · Unisoft handles prep + booking guidance
Verify on Oracle.com
Microsoft
Take at Unisoft
MOS: Excel Associate (Microsoft 365 Apps)
MO-210 · Foundation Level
~35
Tasks
50 min
Duration
700/1K
Pass
$100
Cost
FormatLive performance-based tasks in Excel
ValidityLifetime — no renewal needed
TopicsWorksheets · Cells · Tables · Formulas · Charts
Booked at Unisoft via Certiport (Pearson VUE partner) · 16 languages
Verify on Microsoft Learn
Microsoft
Take at Unisoft
MOS: Excel Expert (Microsoft 365 Apps)
MO-211 · Expert Level
~35
Tasks
50 min
Duration
700/1K
Pass
$100
Cost
FormatLive performance-based tasks (expert workflows)
ValidityLifetime — no renewal needed
TopicsWorkbook Options (10-15%) · Data Management (30-35%) · Advanced
Formulas/Macros (25-30%) · Advanced Charts/Tables (25-30%)
Booked at Unisoft via Certiport (Pearson VUE partner) · English
Verify on Microsoft Learn
Microsoft
Take at Unisoft
Power BI Data Analyst Associate
PL-300 · Role-Based · Intermediate
40-60
Questions
100 min
Duration
700/1K
Pass
$165
Cost
FormatMCQ · Case studies · Interactive labs
Validity12 months · Free renewal via Microsoft Learn
TopicsPrepare (25-30%) · Model (25-30%) · Visualise (25-30%) · Manage/Secure
(15-20%)
Booked at Unisoft Pearson VUE Centre · 10 languages
Verify on Microsoft Learn
Python Institute
Take at Unisoft
Certified Associate Data Analyst with Python
PCAD-31-02 · OpenEDG
48
Questions
65 min
Duration
75%
Pass
$195
Cost
FormatSingle/multi-select + scenario-based
Validity6 years
SkillsPandas · NumPy · Matplotlib · Seaborn · SQL · ML basics
Booked at Unisoft via OpenEDG TestNow · Online proctored on-site
Verify on PythonInstitute.org
Salesforce · Tableau
Take at Unisoft
Salesforce Certified Tableau Data Analyst
Analytics-DA-201 · Industry-recognised
60
Questions
105 min
Duration
65%
Pass
$250
Cost
FormatMCQ + active screen + hands-on lab
Validity24 months · Retake current exam to renew
TopicsConnect data · Explore/Analyse · Create Content · Share Insights · Site
Admin
Booked at Unisoft Pearson VUE Centre (in-person or OnVUE) · English + Japanese
Verify on Tableau.com
The 4-Step Path
How You Get Certified at Unisoft
From your first Excel formula to a globally recognised cert hanging on your LinkedIn — handled end-to-end at our Dharampeth campus. No running between coaching, practice and exam centres.
01
Master the Syllabus
Complete the relevant Data Analyst track. Every module is mapped to a certification's objectives — not just our internal curriculum.
02
Mock Tests & Practice
Topic-wise quizzes followed by 3-5 full-length timed mocks. We don't book your real attempt until you're scoring 80%+ on simulated papers.
03
Book Your Slot
Counsellor reserves your exam slot — Pearson VUE, Certiport, OpenEDG or Oracle TN as the cert requires. No external test-centre running around.
04
Pass & Add to LinkedIn
Sit for the exam at our campus. Digital certificate & Credly badge arrive in 24-48 hrs — add it to LinkedIn, resume and your portfolio site the same day.
The Recruiter Edge
Why a Global Cert Multiplies Your Resume
Certifications are how recruiters quickly separate "I know SQL" from "I can prove I know SQL" — at scale, across cities and continents. Here's what a Microsoft / Oracle / Tableau / Python cert actually does for your career.
200+ countries
Globally Recognised
Microsoft, Oracle, Salesforce and Python Institute certs are accepted in every IT hiring market — Bangalore, Pune, Dubai, Toronto, Singapore.
25-40% uplift
Salary Boost
Industry data consistently shows certified data analysts earn 25-40% more than uncertified peers in the same role. Many MNCs run cert-tied bonus structures.
6× more views
Recruiter Confidence
LinkedIn data shows certified profiles get up to 6× more recruiter views. The credential removes the trust gap — no need to argue you know SQL; the cert proves it.
direct ATS hit
Interview Edge
Cert-aligned prep means you've already answered the exact question-format interviewers use. PL-300 candidates ace Power BI rounds; OCA holders ace SQL screening.
Training Tracks
Choose Your Learning Path
Select the track that fits your goals and background. All tracks include placement assistance.*
Foundation
Excel + SQL Track
Perfect for beginners and freshers looking to enter data roles or MIS positions.
₹35,000
/ full track
EMI from ₹5,000/month*
Advanced Microsoft Excel
Oracle AI Database 23.26.1
MO-210 / 1Z0-171 Exam Prep
Placement Assistance*
Most Popular · Best Value
Pro
Full Data Analyst Program
Our flagship 6-8 month program — the complete data analyst stack with internship.
₹55,000
/ full track
EMI from ₹5,000/month*
Advanced Excel + SQL
Python for Data Analysis
Power BI or Tableau (choose)
6-Week Internship Letter
Capstone Live Project
100% Placement Assistance*
Advanced
Data Science & ML Track
For professionals wanting to advance into data science, ML and AI roles.
₹85,000
/ full track
EMI from ₹5,000/month*
Full Analyst Program included
Machine Learning & AI
R Language for Statistics
Extended Placement Support*
EMI from ₹5,000/month* available across all tracks via partner financiers — final monthly
amount depends on track price and approved tenure (longer tenure = lower EMI). 100% placement assistance is
included in every track; outcomes depend on individual performance and market conditions.
* EMI duration varies by track — ₹5,000/month is the minimum starting plan, subject to financier eligibility and approved tenure. Counsellor will share the exact plan during enrolment.
FAQ
Frequently Asked Questions
Who can enrol in this Data Analyst course?
Students, graduates, working professionals and career-switchers are all
welcome. No prior coding experience is required for the foundation track.
What is the difference between a data analyst course and a data analytics course?
They're effectively the same career path — "data analyst" is the job role,
"data analytics" is the field. At Unisoft, our data analyst course and
data analytics course in Nagpur are the same program: Excel, SQL, Python and Power
BI/Tableau, leading to data analyst, business analyst and BI analyst roles. Whichever term you
searched for, this is the course you're looking for.
Is there a data analyst course near me in Nagpur?
Our campus is in Dharampeth, Nagpur — 2nd Floor, Prananand
Building, West High Court Road (above Anand Bhandar, opposite Dress Code), walking distance from
Sitabuldi and Civil Lines, with easy access from Mahal, Itwari, Pratap Nagar and Sadar. Students
from across Vidarbha — Amravati, Akola, Wardha, Yavatmal, Chandrapur — attend via weekend hybrid or
fully online live batches, so "data analyst course near me" is covered wherever you are.
Do you offer data analyst classes on weekends and online?
Yes. We run classroom, weekday, weekend and fully online live data
analyst classes in Nagpur. Working professionals typically choose weekend or evening
batches; out-of-town Vidarbha students choose the online live cohort with the same curriculum,
mentor support, internship and certification preparation.
What tools are covered in the Data Analyst program?
We cover Microsoft Excel (Advanced), Oracle AI Database 23.26.1, Python
(Pandas, NumPy,
Matplotlib), Power BI and Tableau — depending on the track you choose.
What skills will I gain to become a data analyst?
You'll gain eight employer-valued data analyst skills: Data
Cleaning & Wrangling, SQL Querying & Joins, Statistical Analysis, Data Visualisation &
Dashboards, Python for Data Automation, Business & Domain Acumen, Data Storytelling &
Communication, and Advanced Excel Modelling. Each is mapped to a curriculum module and a
global certification — see the Skills & Outcomes section above for the full breakdown.
Is the internship experience included?
Yes. Students in our Pro and Advanced tracks receive a 6-week internship
certificate with live project exposure at Unisoft or a partnered company.
Do you offer placement support?
We provide 100% job placement assistance — including resume building, mock
interviews, and connections to 200+ hiring partners across Nagpur and beyond.*
What makes this data analytics course in Nagpur unique?
Our program combines core skills in Excel, SQL and Python with an elective
module in advanced visualisation (Power BI or Tableau), live mentorship, hands-on projects and a 6-week
internship for real-world experience — all at an Oracle Authorised Training Centre.
Are batches available on weekends?
Yes. We offer weekday, weekend and hybrid batches to suit working
professionals
and students. Online 1-on-1 sessions are also available with our dedicated online trainer.
How long does the Data Analyst course in Nagpur take?
The flagship Pro track runs 6-8 months at 1.5-2 hour
daily classes (or weekend sessions). The Foundation (Excel + SQL) track can be completed in 3-4
months, and the Advanced Data Science track extends to 8-10 months including ML and R modules.
What are the fees for the Data Analyst course at Unisoft?
Transparent fees, no hidden charges:
Foundation Track — ₹35,000 (Excel + SQL),
Pro Track — ₹55,000 (Full Data Analyst Program with internship),
Advanced Track — ₹85,000 (Data Science + ML + R). EMI plans start as low as
₹5,000/month* through partner financiers — final amount depends on track and
approved tenure. WhatsApp +91 95030 05060 for the detailed brochure.
Is data analytics a good career in Nagpur and Vidarbha?
Yes. Nagpur's IT corridor — MIHAN SEZ, Hingna IT Park, Persistent, TCS,
Infosys — combined with growing BPM/KPO presence in Amravati and Akola has created consistent demand.
Entry-level data analyst roles in Nagpur start at ₹3.5L-₹6L, with experienced
analysts earning ₹10L+.
Can a B.Com / MBA / BCA student become a data analyst?
Absolutely. B.Com graduates bring finance context (a high-value combo with
SQL + Power BI), MBAs bring business acumen for BI roles, and BCA/MCA students bring programming
strength. We have placed graduates from all three streams in analyst roles within 3 months of
completion.
What is the average data analyst salary in Nagpur?
Entry-level: ₹3.5L-₹6L per year. Mid-level (2-4 years):
₹6L-₹12L. Senior (4+ years): ₹10L-₹18L. Specialised roles like BI
Analyst and Power BI Developer typically earn 15-20% more than generalist analysts in the same
experience band.
Is data analyst a hard job?
Data analysis is a learnable, structured skill — not an
impossibly hard one. It needs logical thinking and attention to detail, but no advanced
maths or heavy coding for most roles. Beginners from non-technical backgrounds (B.Com, BBA, BA) clear
it comfortably when the learning is sequenced right — Excel first, then SQL, then visualisation, then
Python. Our trainers report that the "hard" feeling usually comes from learning tools in the wrong
order, which our structured curriculum fixes.
Can I become a data analyst in 3 months?
You can become job-ready in the core skills in about 3-4
months with our Foundation track (Advanced Excel + SQL) if you study consistently — enough
to apply for entry-level data analyst and MIS roles. To be fully competitive with Python, Power BI/
Tableau, a portfolio and an internship, the 6-8 month Pro track is the realistic timeline. Three
months gets you started; the full program gets you hired.
Is Python compulsory for data analysts?
Not strictly — many analyst roles only require Excel, SQL and Power
BI/Tableau, and our Foundation track gets you there. However, Python widens your job pool
considerably and is essential for senior roles, machine learning, and the data scientist trajectory.
It's included in the Pro and Advanced tracks.
Do I need a maths or statistics background to enrol?
No. Comfort with basic high-school maths is enough for the Data Analyst
track. We teach the statistics relevant to data analysis — descriptive statistics, distributions,
correlation, hypothesis testing — inside the course. Strong stats only matters if you're targeting
the Advanced Data Science track.
What is the difference between a data analyst and a data scientist?
A data analyst answers "what happened and why" using SQL,
Excel and BI tools — the role most companies hire for. A data scientist builds
predictive models with Python and machine learning to forecast "what will happen next". Most data
scientists started as analysts and grew into the role. Read the full
Data Analyst vs Data Scientist comparison →
Power BI or Tableau — which should I learn first?
Both are excellent. Power BI has wider corporate adoption
in India and a gentler learning curve — best for finance, banking and Microsoft-stack companies.
Tableau has stronger visualisation craft and is preferred by analytics consulting
firms. Our Pro track lets you specialise in either; see the decision matrix above.
Which global certifications can I sit for at Unisoft?
Unisoft is a Pearson VUE Authorised Test Centre since 2010.
You can book and sit for the following exams at our Dharampeth campus:
Microsoft MO-210 (Excel Associate), MO-211 (Excel Expert),
PL-300 (Power BI Data Analyst), Python Institute PCAD (Certified
Associate Data Analyst with Python) via OpenEDG TestNow, and the Salesforce Certified Tableau
Data Analyst via Pearson VUE. The Oracle 1Z0-171 exam is delivered online
by Oracle's own Testing Network since September 2022 — we handle preparation, booking guidance and
proctoring setup.
Why do some Unisoft trainers have fewer years of experience than Saurabh sir?
Every trainer at Unisoft follows Saurabh sir's curriculum
and is mentored by him for 6+ months before independently delivering a batch.
Junior trainers focus on a single specialised subject — Python, SQL or Power BI — meaning they know
that topic cold, often more current with the latest tool versions and 2026 interview patterns than
any generalist would be. You get senior-architected curriculum delivered by industry-current
specialists. The model mirrors how IIT, IIM and Harvard operate: senior faculty design courses;
specialised assistant professors deliver them.
Find Us
Visit Unisoft Technologies in Nagpur
Located in Dharampeth — one of Nagpur's most trusted IT training institutes for Data Analytics, SQL, Python and Power BI.
Address
2nd Floor, Prananand Building, West High Court Road, Above Anand Bhandar, Opp Dress Code,
Dharampeth, Nagpur 440010
Contact
+91 712 6606353 / 6606355 / 6606375
Open: 08:00 – 21:00, Mon – Sun
Get Started
Enroll in the Data Analyst Program
Fill out the form below to secure your seat or schedule a free counselling session with our academic advisors.
Related reading
Power BI vs Tableau: which should you learn first? — licensing, DAX against LOD expressions, and which one employers in Nagpur actually ask for.
Data analyst vs business analyst: which role is actually for you? — why the pay gap is real but mostly buys a different job.
Java vs Python for freshers: which should you learn first? — what actually decides a fresher’s first salary in India.